Infographics, diagrams, or multi-element compositions
프롬프트 텍스트
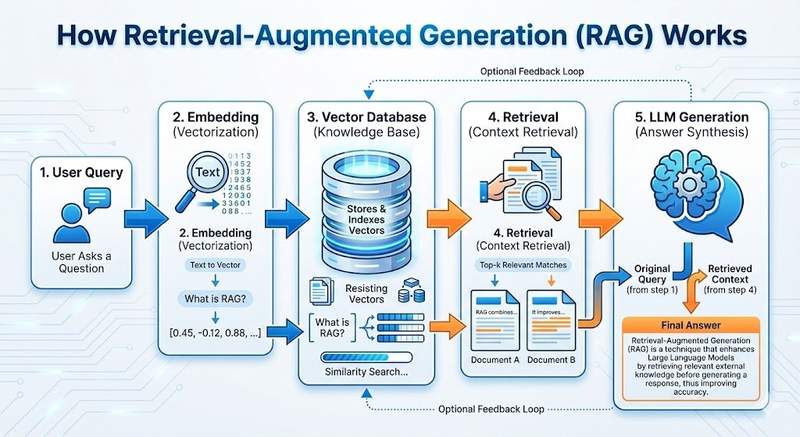
{ "mode": "thinking", "composition": "technical infographic explaining how RAG systems work", "reasoning_requirements": [ "arrange flowchart elements logically from left to right", "show data flow with clear arrows and labels", "include 5 distinct components: user query, embedding, vector database, retrieval, LLM generation", "ensure all text labels are legible and accurately describe each step" ], "visual_goal": "educational clarity with professional design", "color_scheme": "tech blue and white with orange accents for emphasis", "text_rendering": "clean sans-serif, hierarchy from large titles to small labels" }
AI 도움으로 나만의 변형 만들기
무료 AI API로 개발하기
무료 OpenAI 호환 LLM API. 무료 키를 발급받아 Llama, Gemini 등과 대화하거나 단일 엔드포인트로 개발하세요.