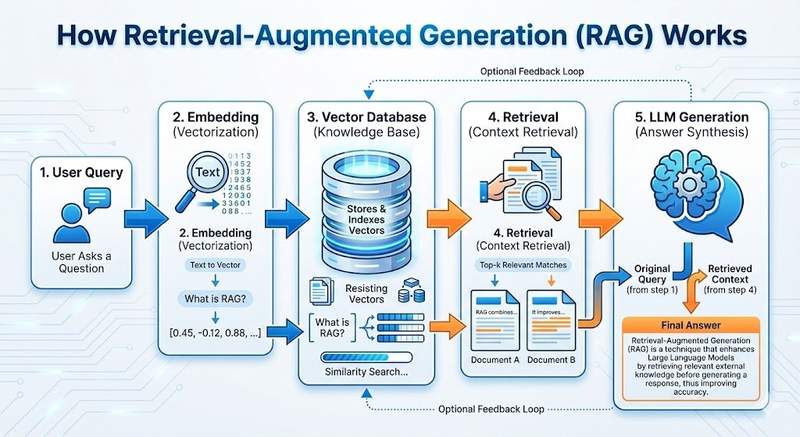
Infographics, diagrams, or multi-element compositions
Prompt Text
{ "mode": "thinking", "composition": "technical infographic explaining how RAG systems work", "reasoning_requirements": [ "arrange flowchart elements logically from left to right", "show data flow with clear arrows and labels", "include 5 distinct components: user query, embedding, vector database, retrieval, LLM generation", "ensure all text labels are legible and accurately describe each step" ], "visual_goal": "educational clarity with professional design", "color_scheme": "tech blue and white with orange accents for emphasis", "text_rendering": "clean sans-serif, hierarchy from large titles to small labels" }
Create your own variation with AI assistance
Build with our free AI API
A free, OpenAI-compatible LLM API. Get a free key, then chat with Llama, Gemini and more, or build with one endpoint.